Introducing real-time health alerts for charging points
Empowering operators with clear health indicators and thermal monitoring to ensure peak charger performance and reduce avoidable hardware damage.
Product Design


Project Overview
Client:
Zeon Electric is driving India's EV revolution by building a reliable, accessible charging network operating over 500 charge points and have electrified 15,000+ kms of highways.
My Role:
UI/UX Design Intern
Collaborated with the design team to enhance the ZWIZ CMS Dashboard user experience. Key contributions included designing intuitive health indicators and streamlining navigation to detailed KPI views on the Station Page.
Timeline:
April-May (2024)
Tools:
Figma
Team Members:
Mohammed Hayas (Senior Designer), Madan S (Team Head Network Operations).
Health of Charging Stations
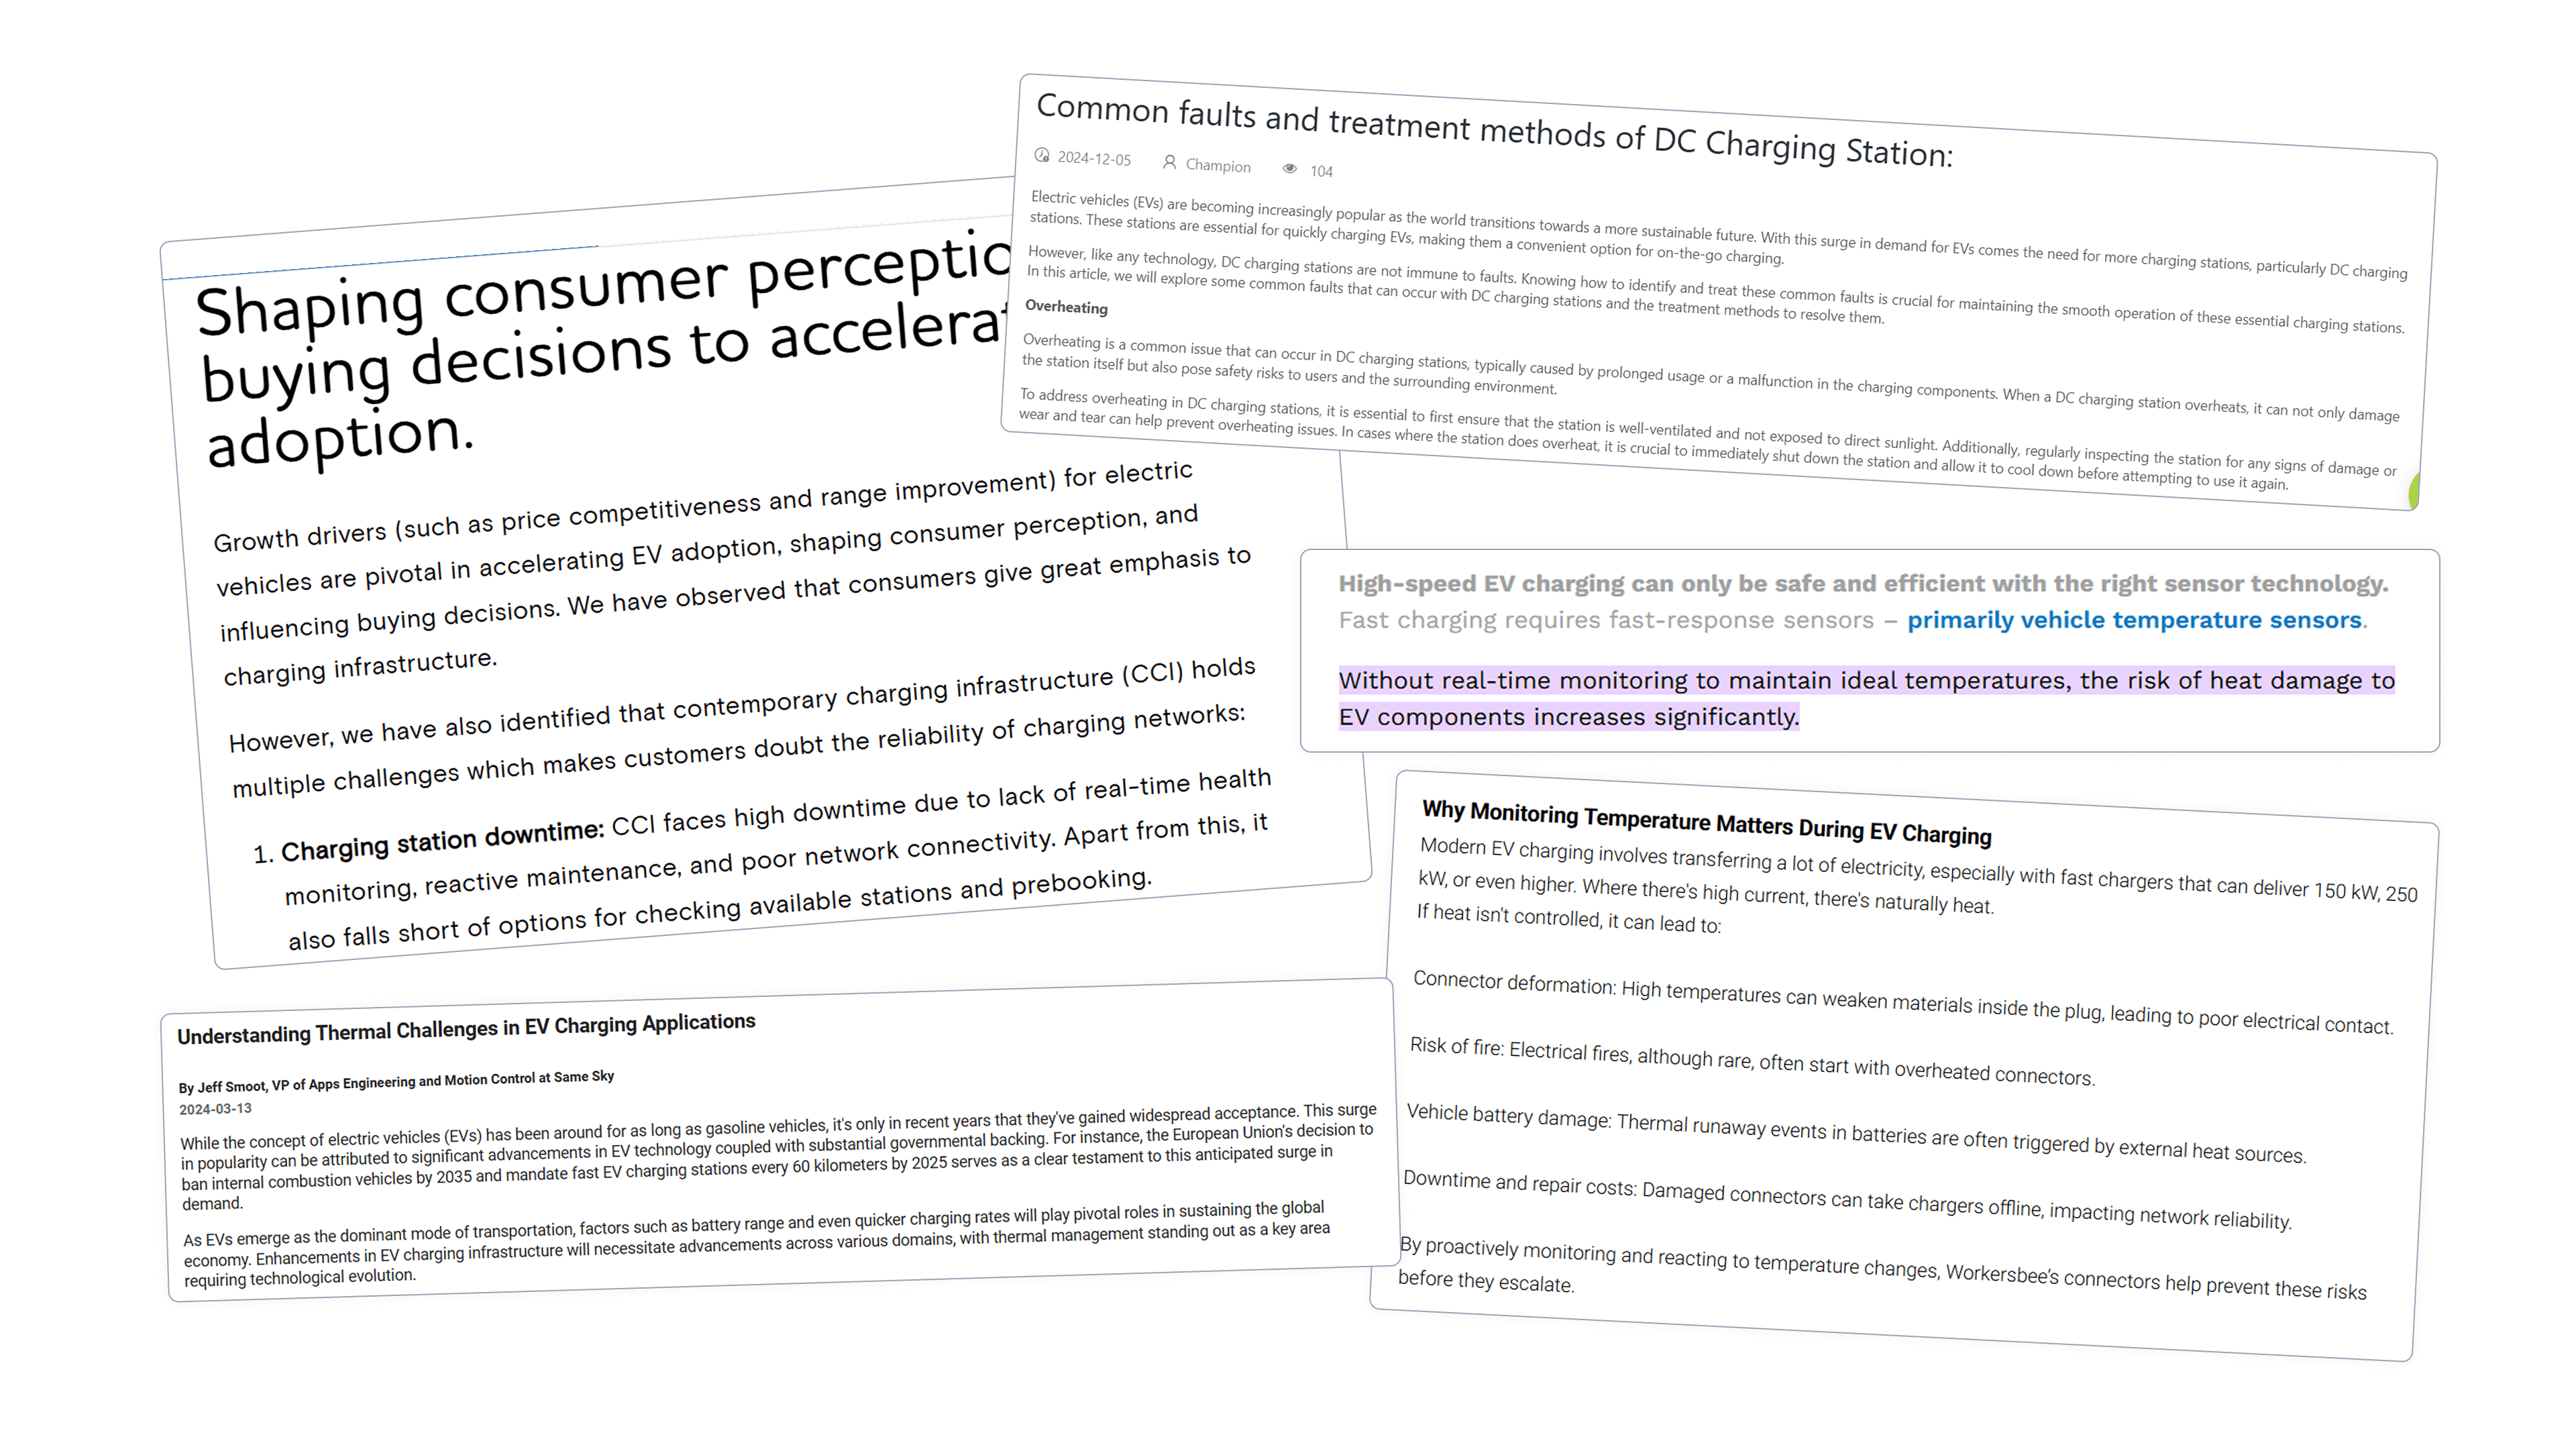
Health of charger is crucial in EV charging stations because it helps maintain the ideal operating temperature of the chargers. When chargers heat up beyond safe limits, it can lead to slower charging speeds, sudden shutdowns, hardware damage, and higher maintenance costs.
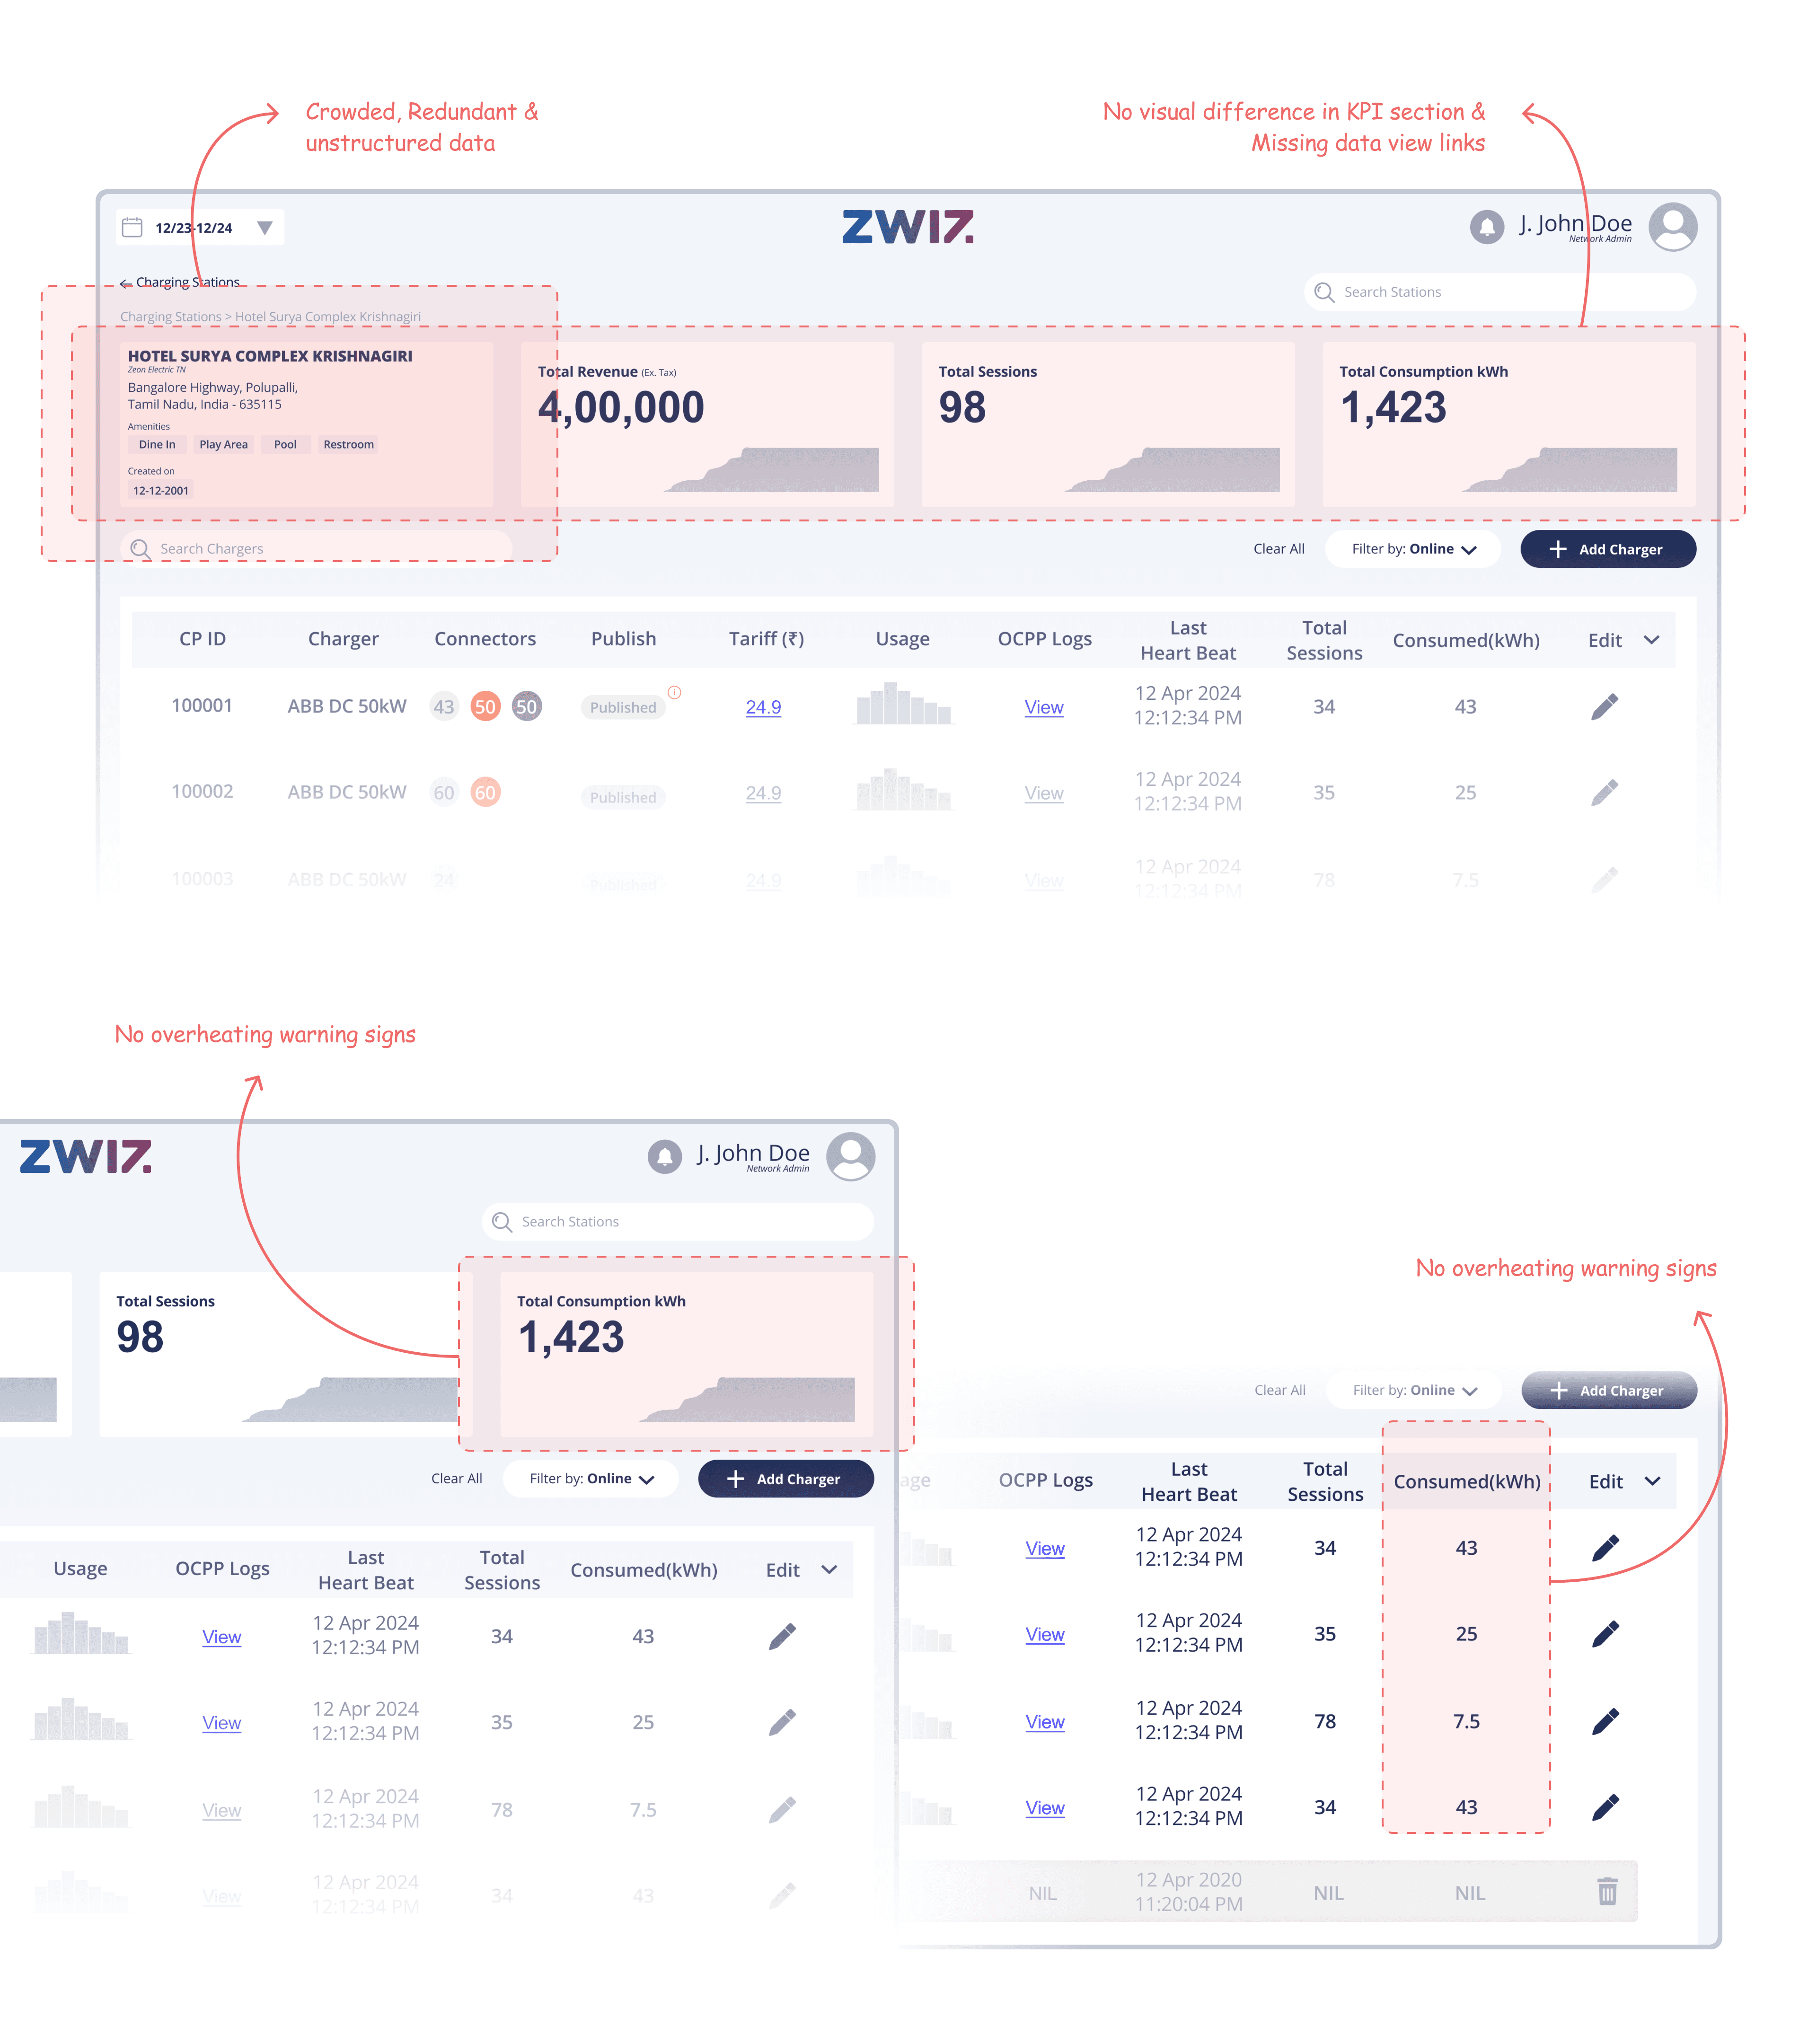
Current Limitations
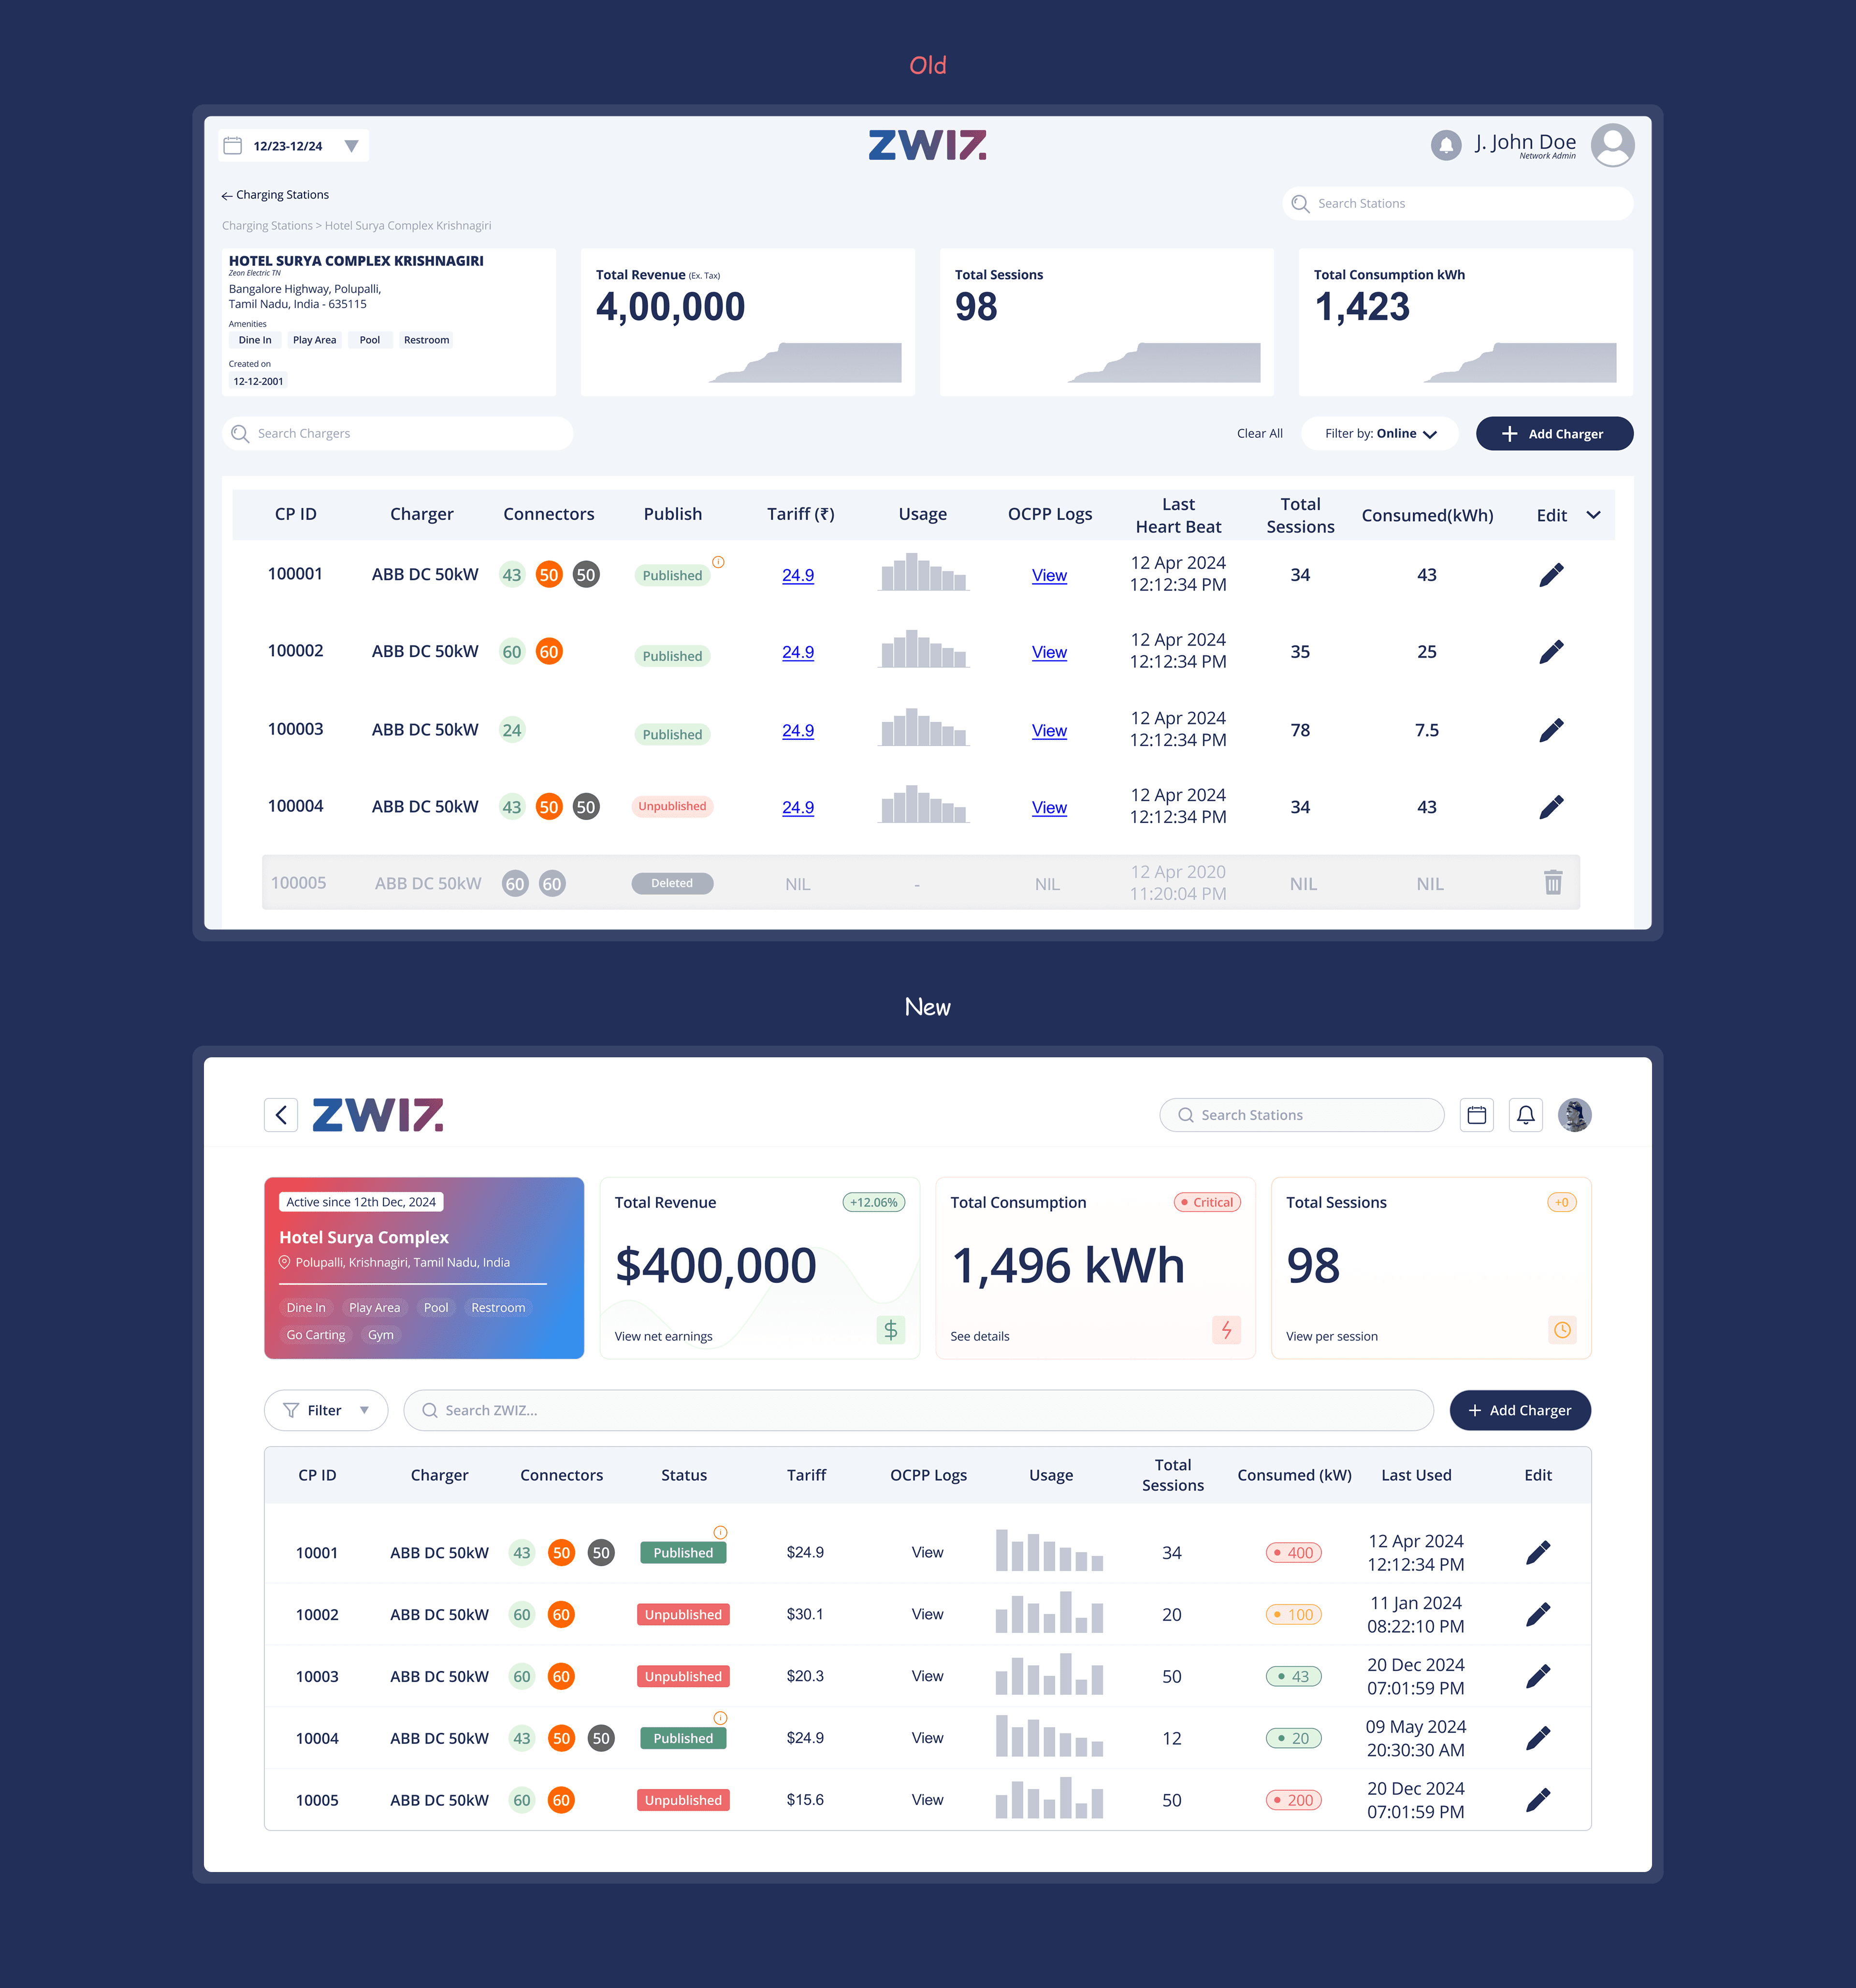
Lack of visual differentiation in the Key Performance Indicator (KPI) section lead to cognitive overload and delayed response times, particularly for time-sensitive issues like overheating.
Redirection to detailed view of each KPI was not available.
A busy EV charger kept shutting down and the real issue was overheating. But the dashboard only showed usage data, so operators missed the warning signs until technicians discovered the heat problem after multiple visits.
Hence, we concluded..
ZWIZ CMS users missed critical 🔥overheating alerts because the KPI section lacked visual differentiation leading to avoidable shutdowns and costly 🔨repairs.
Ideation and Process
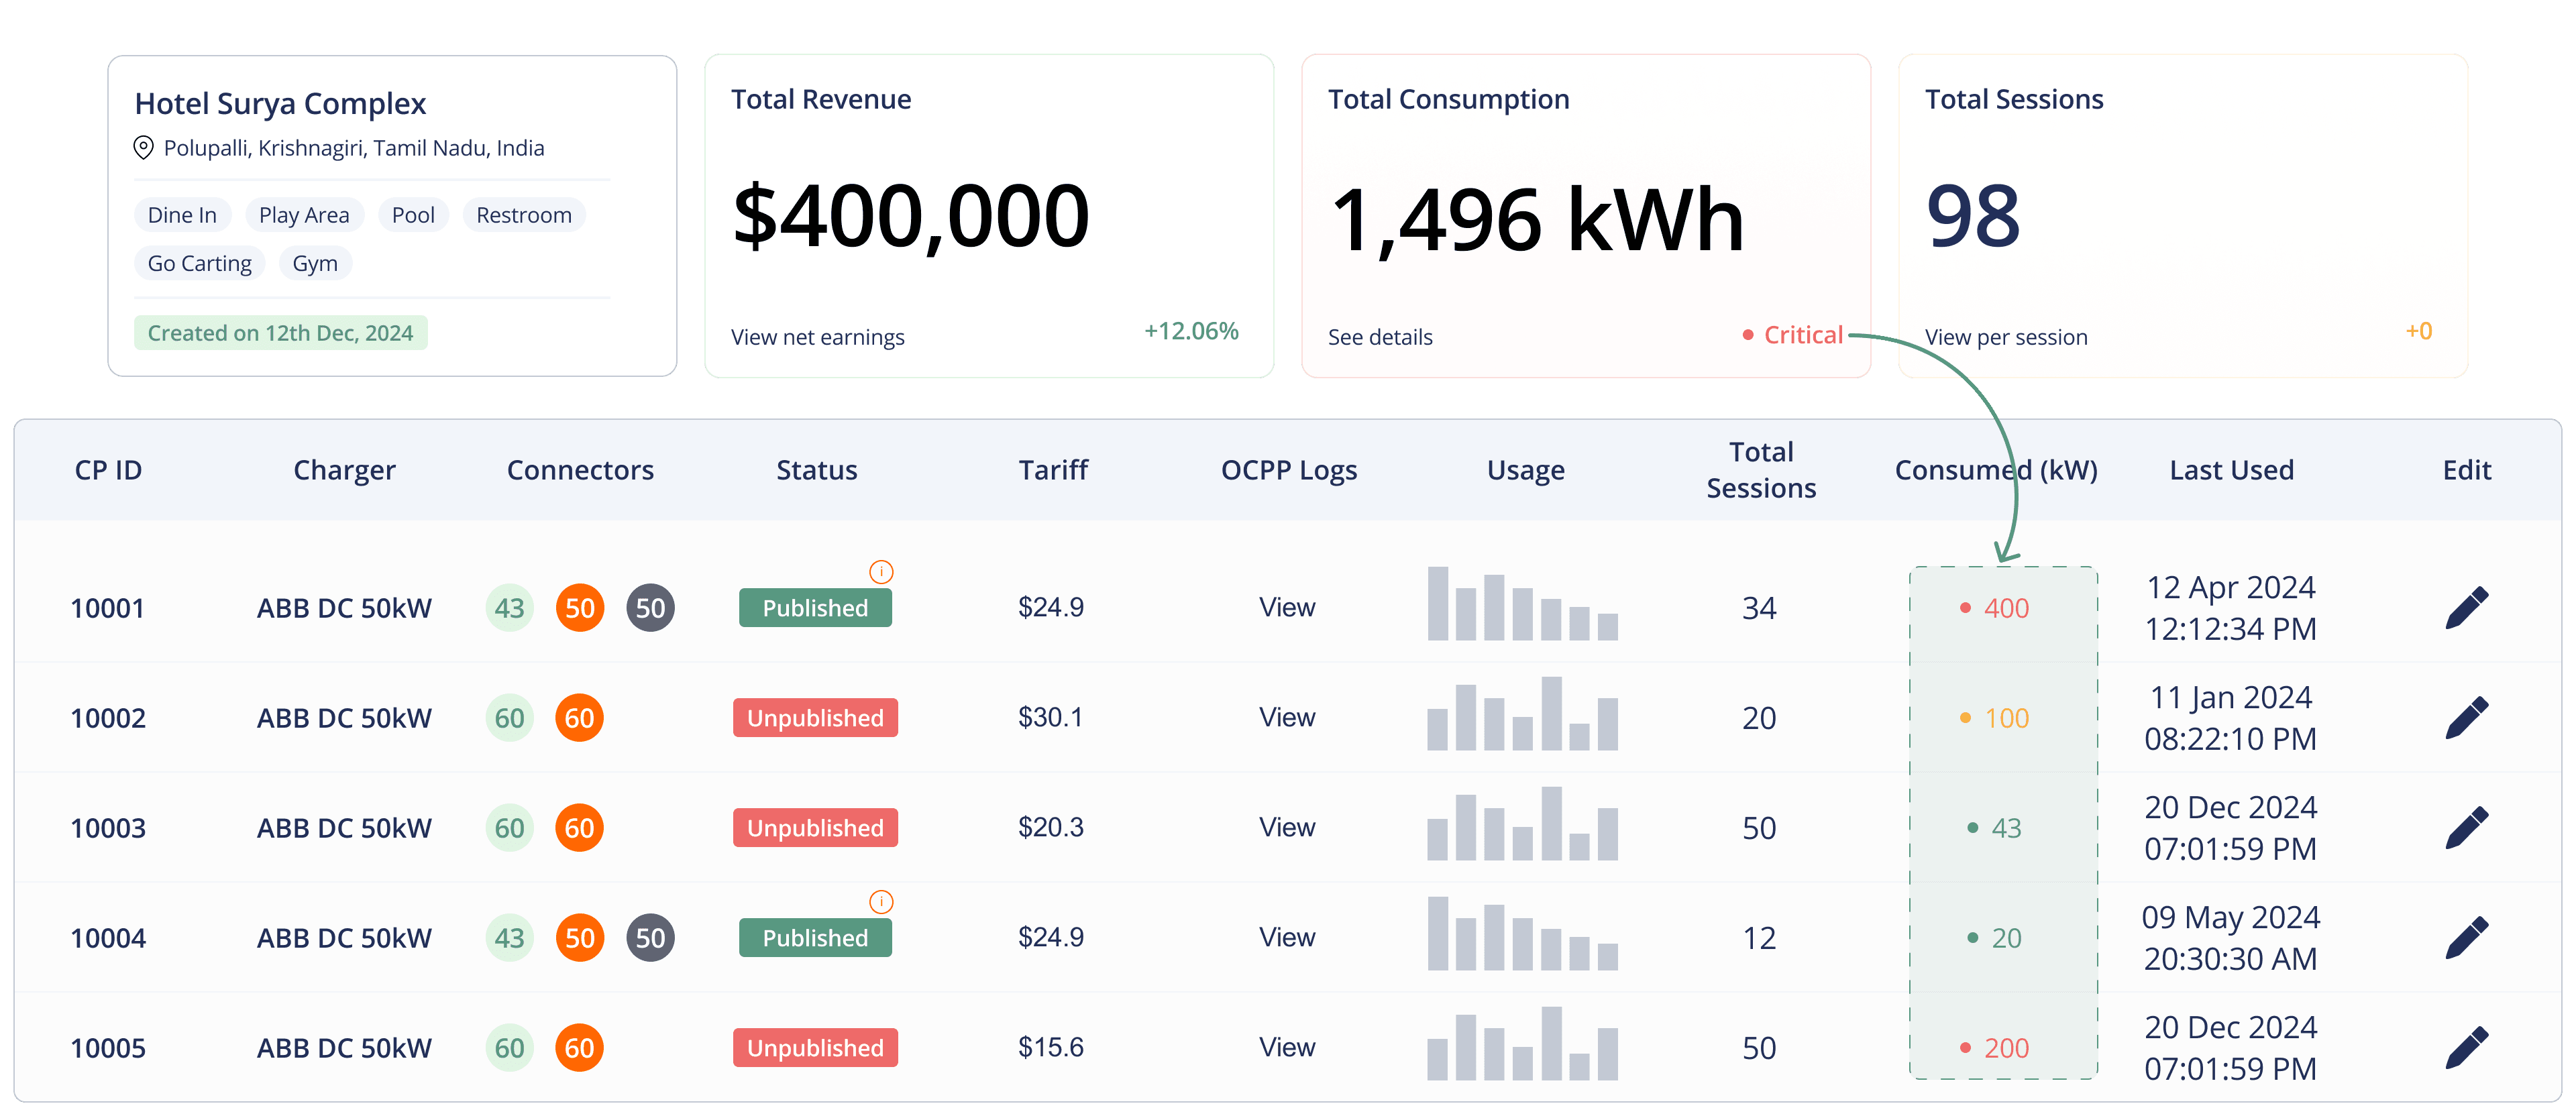
Direction #1 😁
I chose this because it effectively balanced high-level monitoring with actionable depth. By integrating proactive alerts directly into the KPI section and providing a clear path to detailed data, it successfully reduced the time to detection for critical issues like overheating, directly addressing the project’s goal of minimizing charger downtime and hardware damage.
✅ Pros | ❌ Cons |
|---|---|
Provides direct access to detailed KPI views | Suffers from inconsistent KPI alerting logic |
Integrated with heating and comparison alerts | Lack of visual differentiation between elements |
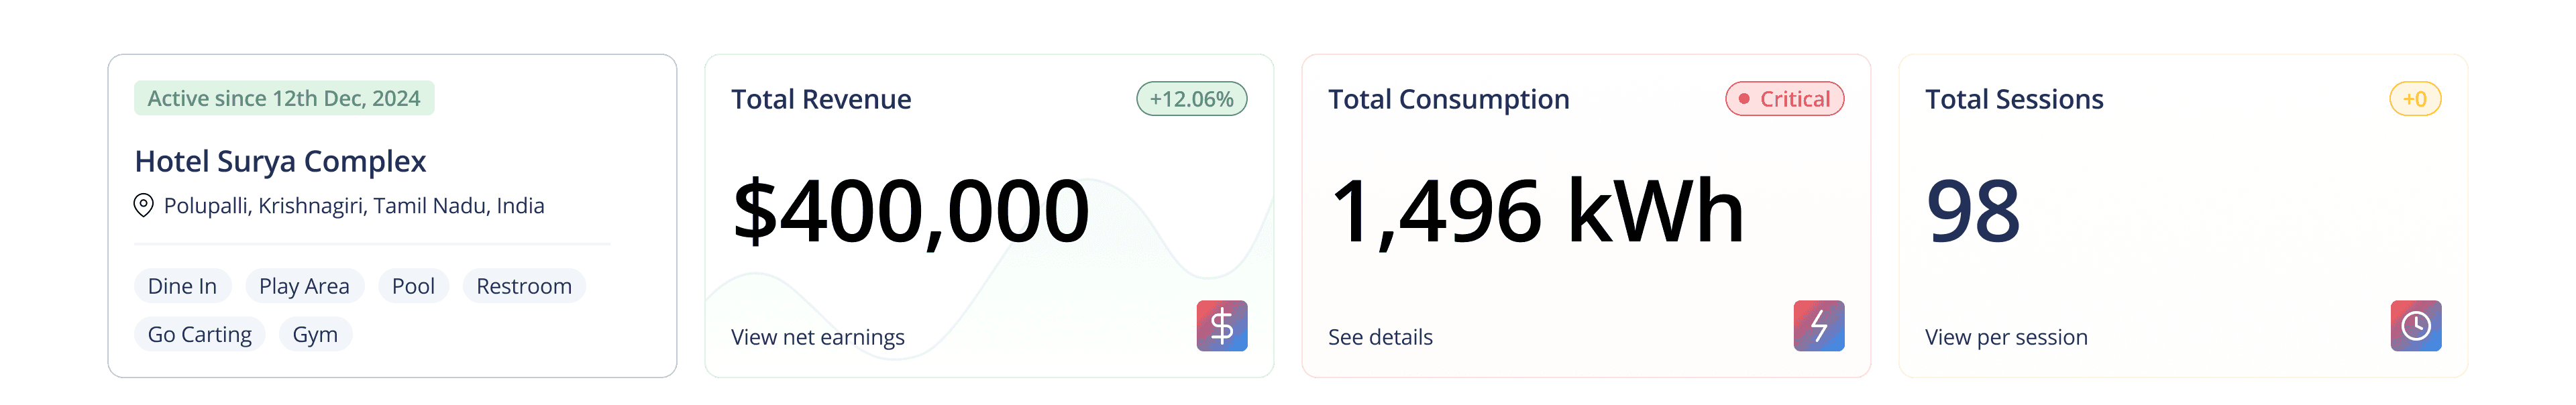
Direction #408… 😵
Just before the final approach the focus was shifted to provide a consistent heating alerts warning label for all the KPIs. This direction explored a specialized layout that prioritized consumption trends as the primary indicator of charger health.
✅ Pros | ❌ Cons |
|---|---|
Provides consistent heating alerts for the Total Consumption metric | KPI icons lack visual alignment with heating alerts, creating an inconsistent hierarchy |
Final Approach
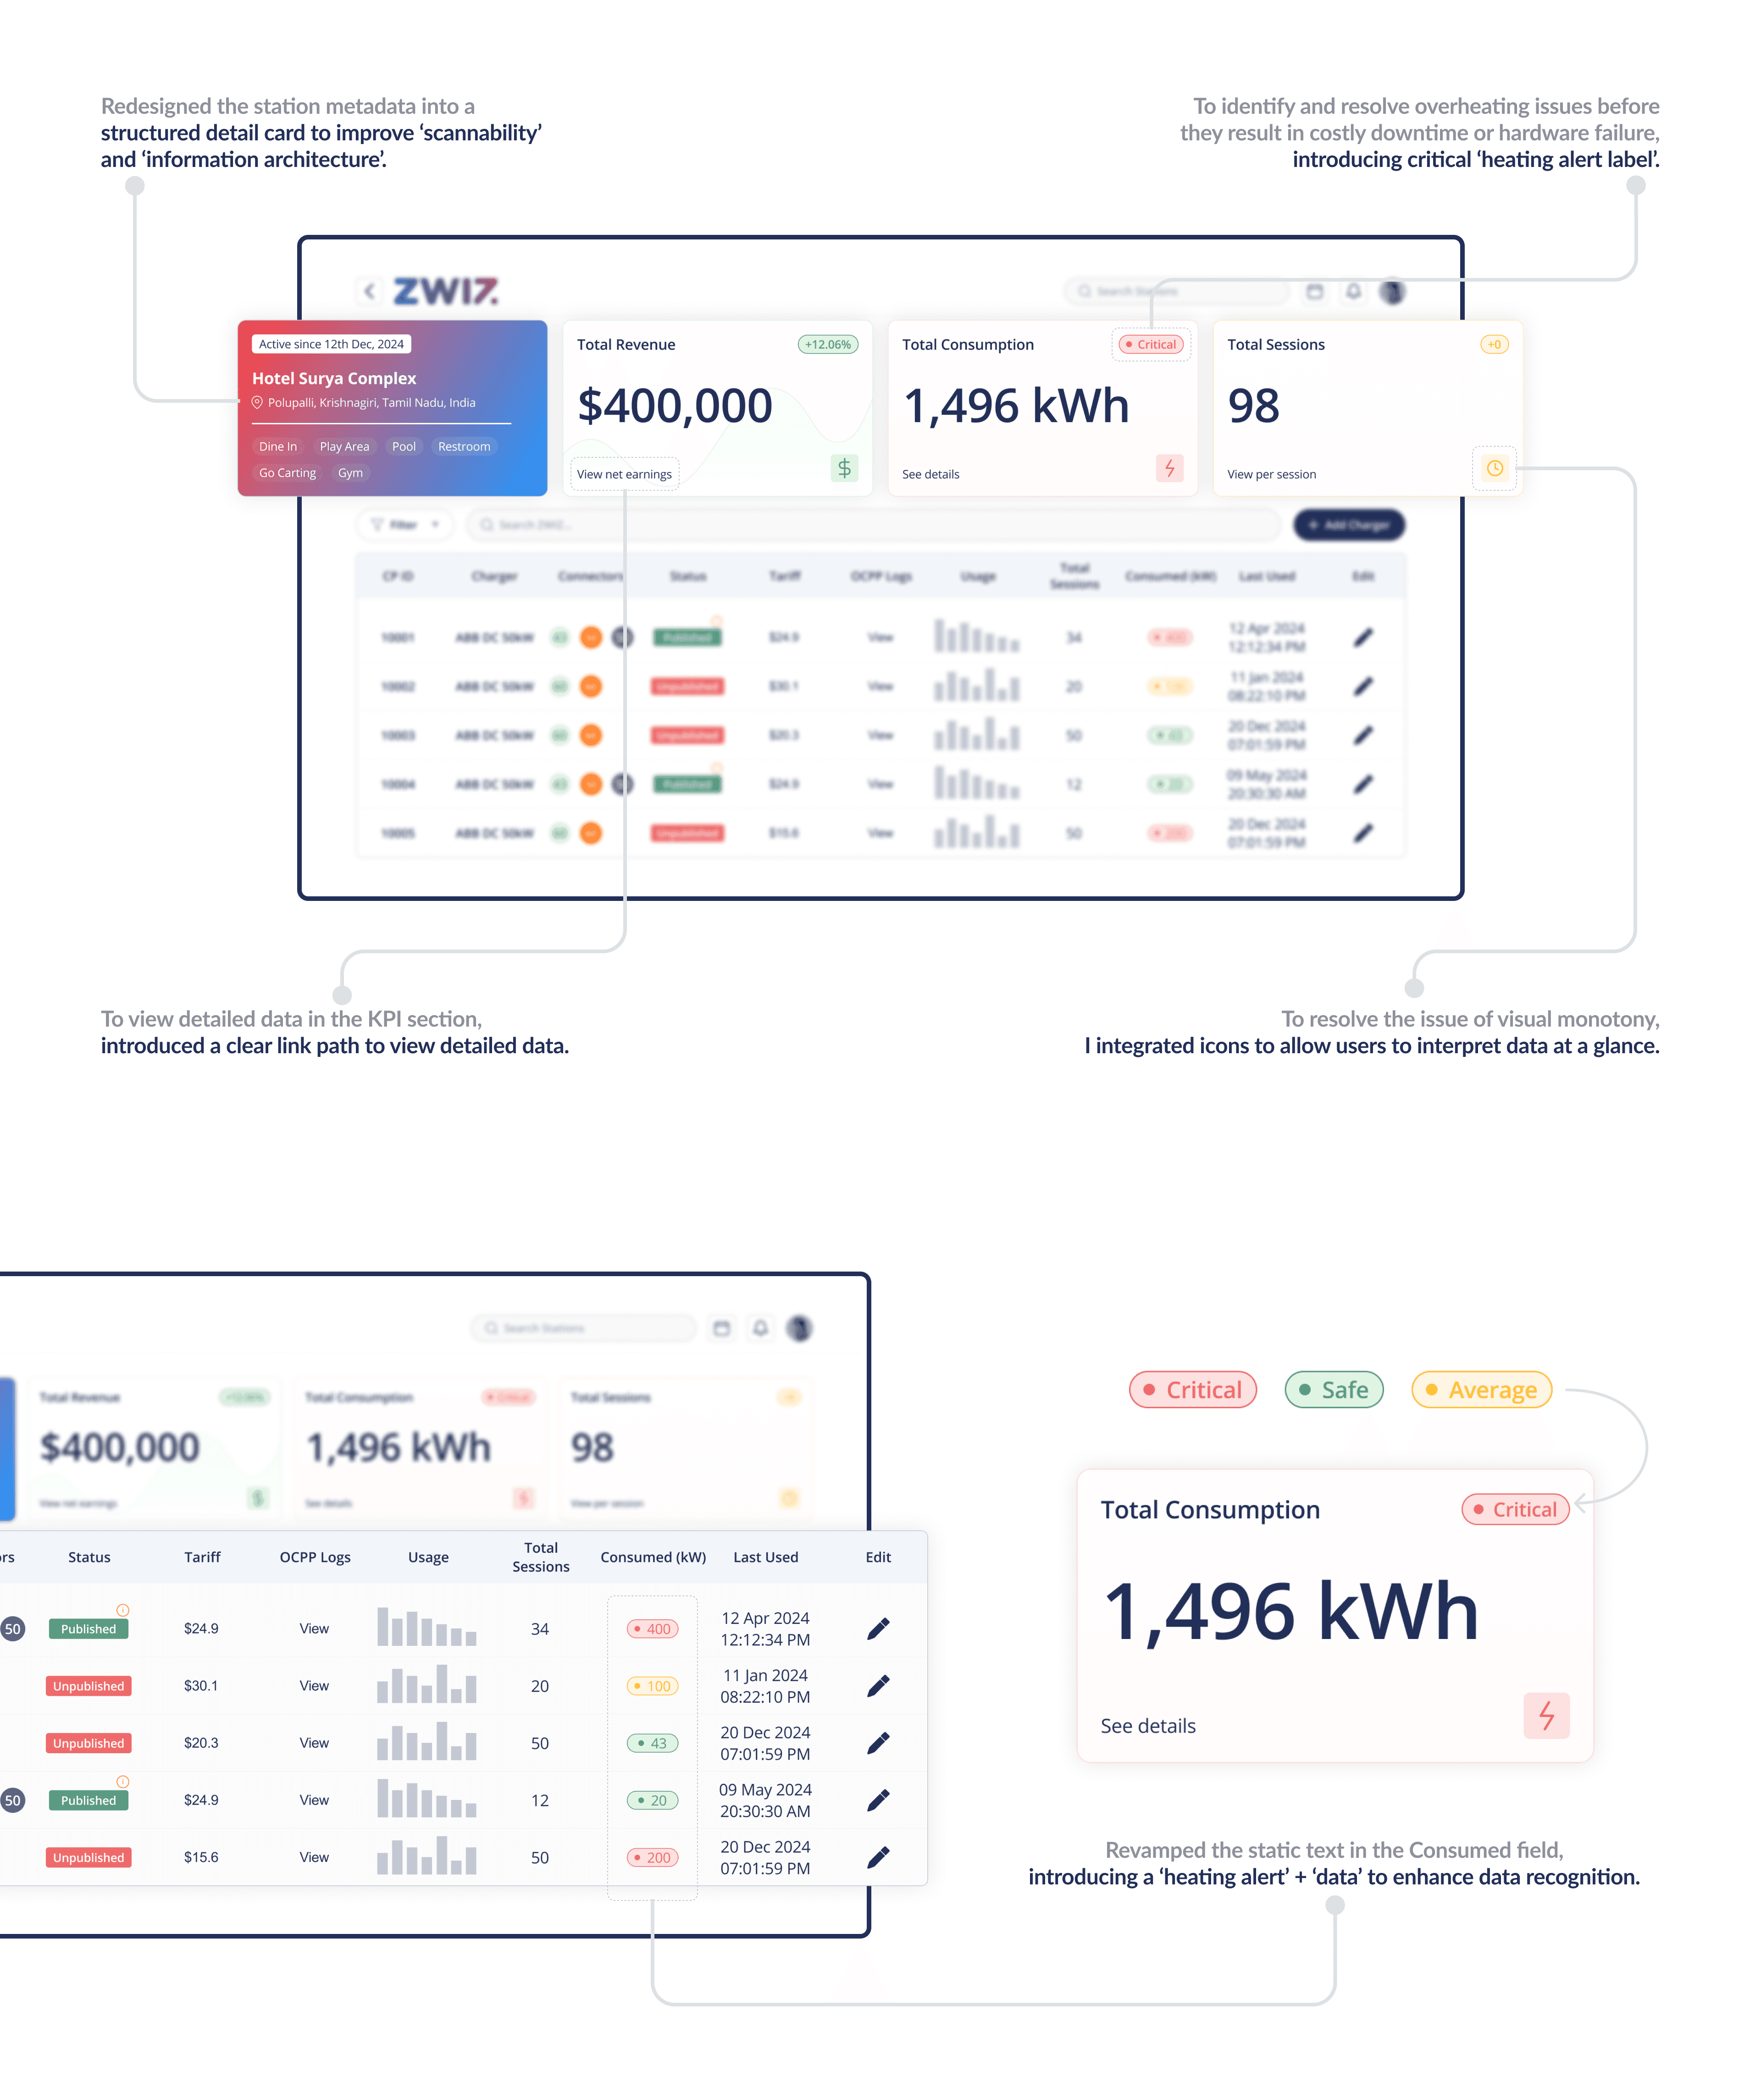
The final design resolves the challenge of visual indifference by applying a disciplined visual hierarchy. By combining proactive alerting with intuitive navigation, this UI empowers ZWIZ CMS operators to identify and resolve overheating issues before they result in costly downtime or hardware failure.
Usability and Testing
User testing was outside the initial project scope due to the internship timeline, but the designs were internally reviewed by the team.
Challenges and Learnings
Initially, I over-focused on the visual design of KPI cards like "Revenue" before realizing that hardware health and failure detection were the true priorities for operators.
For a long time, I felt I lacked enough specific EV hardware research to start. In reality, I wasn't tapping the potential of the operational data already available in the CMS.
Even though I had the data, I needed more time to develop a concept that allowed operators to act on it. By introducing a structured "detail card" and clear links to deep-dive data, I moved beyond just showing numbers to building a system that helps operators manage a reliable charging network.
By redesigning the station card and KPI section, I transformed the dashboard from a passive data display into a proactive monitoring tool. These changes allow operators to identify overheating risks instantly, helping Zeon Electric prevent charger downtime and avoid high maintenance costs across their network.